%20--%3e%3csvg%20version='1.1'%20xmlns='http://www.w3.org/2000/svg'%20xmlns:xlink='http://www.w3.org/1999/xlink'%20x='0px'%20y='0px'%20viewBox='0%202%2048%2048'%20enable-background='new%200%202%2048%2048'%20xml:space='preserve'%3e%3cpolygon%20fill='%23ECEFF1'%20points='20.1,18.2%2020.2,20.5%2018.6,23.5%2016.1,28.4%2015.6,32.5%2017.4,38.3%2021.5,40.6%2027.7,40.6%2033.5,36.2%2036.1,29.3%2030.1,22%2028.4,17.9%20'/%3e%3cpath%20fill='%23263238'%20d='M34.3,23.9c-1.6-2.3-2.9-3.7-3.6-6.6c-0.7-2.9,0.2-2.1-0.4-4.6c-0.3-1.3-0.8-2.2-1.3-2.9%20c-0.6-0.7-1.3-1.1-1.7-1.2c-0.9-0.5-3-1.3-5.6,0.1c-2.7,1.4-2.4,4.4-1.9,10.5c0,0.4-0.1,0.9-0.3,1.3c-0.4,0.9-1.1,1.7-1.7,2.4%20c-0.7,1-1.4,2-1.9,3.1c-1.2,2.3-2.3,5.2-2,6.3c0.5-0.1,6.8,9.5,6.8,9.7c0.4-0.1,2.1-0.1,3.6-0.1c2.1-0.1,3.3-0.2,5,0.2%20c0-0.3-0.1-0.6-0.1-0.9c0-0.6,0.1-1.1,0.2-1.8c0.1-0.5,0.2-1,0.3-1.6c-1,0.9-2.8,1.9-4.5,2.2c-1.5,0.3-4-0.2-5.2-1.7%20c0.1,0,0.3,0,0.4-0.1c0.3-0.1,0.6-0.2,0.7-0.4c0.3-0.5,0.1-1-0.1-1.3c-0.2-0.3-1.7-1.4-2.4-2c-0.7-0.6-1.1-0.9-1.5-1.3%20c0,0-0.6-0.6-0.8-0.8c-0.2-0.2-0.3-0.4-0.4-0.5c-0.2-0.5-0.3-1.1-0.2-1.9c0.1-1.1,0.5-2,1-3c0.2-0.4,0.7-1.2,0.7-1.2%20s-1.7,4.2-0.8,5.5c0,0,0.1-1.3,0.5-2.6c0.3-0.9,0.8-2.2,1.4-2.9s2.1-3.3,2.2-4.9c0-0.7,0.1-1.4,0.1-1.9c-0.4-0.4,6.6-1.4,7-0.3%20c0.1,0.4,1.5,4,2.3,5.9c0.4,0.9,0.9,1.7,1.2,2.7c0.3,1.1,0.5,2.6,0.5,4.1c0,0.3,0,0.8-0.1,1.3c0.2,0,4.1-4.2-0.5-7.7%20c0,0,2.8,1.3,2.9,3.9c0.1,2.1-0.8,3.8-1,4.1c0.1,0,2.1,0.9,2.2,0.9c0.4,0,1.2-0.3,1.2-0.3c0.1-0.3,0.4-1.1,0.4-1.4%20C37.6,29.9,35.9,26.2,34.3,23.9z'/%3e%3cg%3e%3cellipse%20fill='%23ECEFF1'%20cx='21.6'%20cy='15.3'%20rx='1.3'%20ry='2'/%3e%3cellipse%20fill='%23ECEFF1'%20cx='26.1'%20cy='15.2'%20rx='1.7'%20ry='2.3'/%3e%3c/g%3e%3cg%3e%3cellipse%20transform='matrix(-0.1254%20-0.9921%200.9921%20-0.1254%208.9754%2038.9969)'%20fill='%23212121'%20cx='21.7'%20cy='15.5'%20rx='1.2'%20ry='0.7'/%3e%3cellipse%20fill='%23212121'%20cx='26'%20cy='15.6'%20rx='1'%20ry='1.3'/%3e%3c/g%3e%3cg%3e%3cpath%20fill='%23FFC107'%20d='M39.3,37.6c-0.4-0.2-1.1-0.5-1.7-1.4c-0.3-0.5-0.2-1.9-0.7-2.5c-0.3-0.4-0.7-0.2-0.8-0.2%20c-0.9,0.2-3,1.6-4.4,0c-0.2-0.2-0.5-0.5-1-0.5c-0.5,0-0.7,0.2-0.9,0.6s-0.2,0.7-0.2,1.7c0,0.8,0,1.7-0.1,2.4%20c-0.2,1.7-0.5,2.7-0.5,3.7c0,1.1,0.3,1.8,0.7,2.1c0.3,0.3,0.8,0.5,1.9,0.5c1.1,0,1.8-0.4,2.5-1.1c0.5-0.5,0.9-0.7,2.3-1.7%20c1.1-0.7,2.8-1.6,3.1-1.9c0.2-0.2,0.5-0.3,0.5-0.9C40,37.9,39.6,37.7,39.3,37.6z'/%3e%3cpath%20fill='%23FFC107'%20d='M19.2,37.9c-1-1.6-1.1-1.9-1.8-2.9c-0.6-1-1.9-2.9-2.7-2.9c-0.6,0-0.9,0.3-1.3,0.7%20c-0.4,0.4-0.8,1.3-1.5,1.8c-0.6,0.5-2.3,0.4-2.7,1c-0.4,0.6,0.4,1.5,0.4,3c0,0.6-0.5,1-0.6,1.4c-0.1,0.5-0.2,0.8,0,1.2%20c0.4,0.6,0.9,0.8,4.3,1.5c1.8,0.4,3.5,1.4,4.6,1.5c1.1,0.1,3,0,3-2.7C21,39.9,20.1,39.5,19.2,37.9z'/%3e%3cpath%20fill='%23FFC107'%20d='M21.1,19.8C20.5,19.4,20,19,20,18.4c0-0.6,0.4-0.8,1-1.3c0.1-0.1,1.2-1.1,2.3-1.1s2.4,0.7,2.9,0.9%20c0.9,0.2,1.8,0.4,1.7,1.1c-0.1,1-0.2,1.2-1.2,1.7c-0.7,0.2-2,1.3-2.9,1.3c-0.4,0-1,0-1.4-0.1C22.1,20.8,21.6,20.3,21.1,19.8z'/%3e%3c/g%3e%3cg%3e%3cpath%20fill='%23634703'%20d='M20.9,19c0.2,0.2,0.5,0.4,0.8,0.5c0.2,0.1,0.5,0.2,0.5,0.2c0.4,0,0.7,0,0.9,0c0.5,0,1.2-0.2,1.9-0.6%20c0.7-0.3,0.8-0.5,1.3-0.7c0.5-0.3,1-0.6,0.8-0.7c-0.2-0.1-0.4,0-1.1,0.4c-0.6,0.4-1.1,0.6-1.7,0.9c-0.3,0.1-0.7,0.3-1,0.3%20c-0.3,0-0.6,0-0.9,0c-0.3,0-0.5-0.1-0.8-0.2c-0.2-0.1-0.3-0.2-0.4-0.2c-0.2-0.1-0.6-0.5-0.8-0.6c0,0-0.2,0-0.1,0.1%20C20.6,18.7,20.7,18.8,20.9,19z'/%3e%3cpath%20fill='%23634703'%20d='M23.9,16.8c0.1,0.2,0.3,0.2,0.4,0.3c0.1,0.1,0.2,0.1,0.2,0.1c0.1-0.1,0-0.3-0.1-0.3%20C24.4,16.7,23.9,16.7,23.9,16.8z'/%3e%3cpath%20fill='%23634703'%20d='M22.3,17c0,0.1,0.2,0.2,0.2,0.1c0.1-0.1,0.2-0.2,0.3-0.2c0.2-0.1,0.1-0.2-0.2-0.2%20C22.4,16.8,22.4,16.9,22.3,17z'/%3e%3c/g%3e%3cpath%20fill='%23455A64'%20d='M32,34.7c0,0.1,0,0.2,0,0.3c0.2,0.4,0.7,0.5,1.1,0.5c0.6,0,1.2-0.4,1.5-0.8c0-0.1,0.1-0.2,0.2-0.3%20c0.2-0.3,0.3-0.5,0.4-0.6c0,0-0.1-0.1-0.1-0.2c-0.1-0.2-0.4-0.4-0.8-0.5c-0.3-0.1-0.8-0.2-1-0.2c-0.9-0.1-1.4,0.2-1.7,0.5%20c0,0,0.1,0,0.1,0.1c0.2,0.2,0.3,0.4,0.3,0.7C32.1,34.4,32,34.5,32,34.7z'/%3e%3c/svg%3e)


🛠️
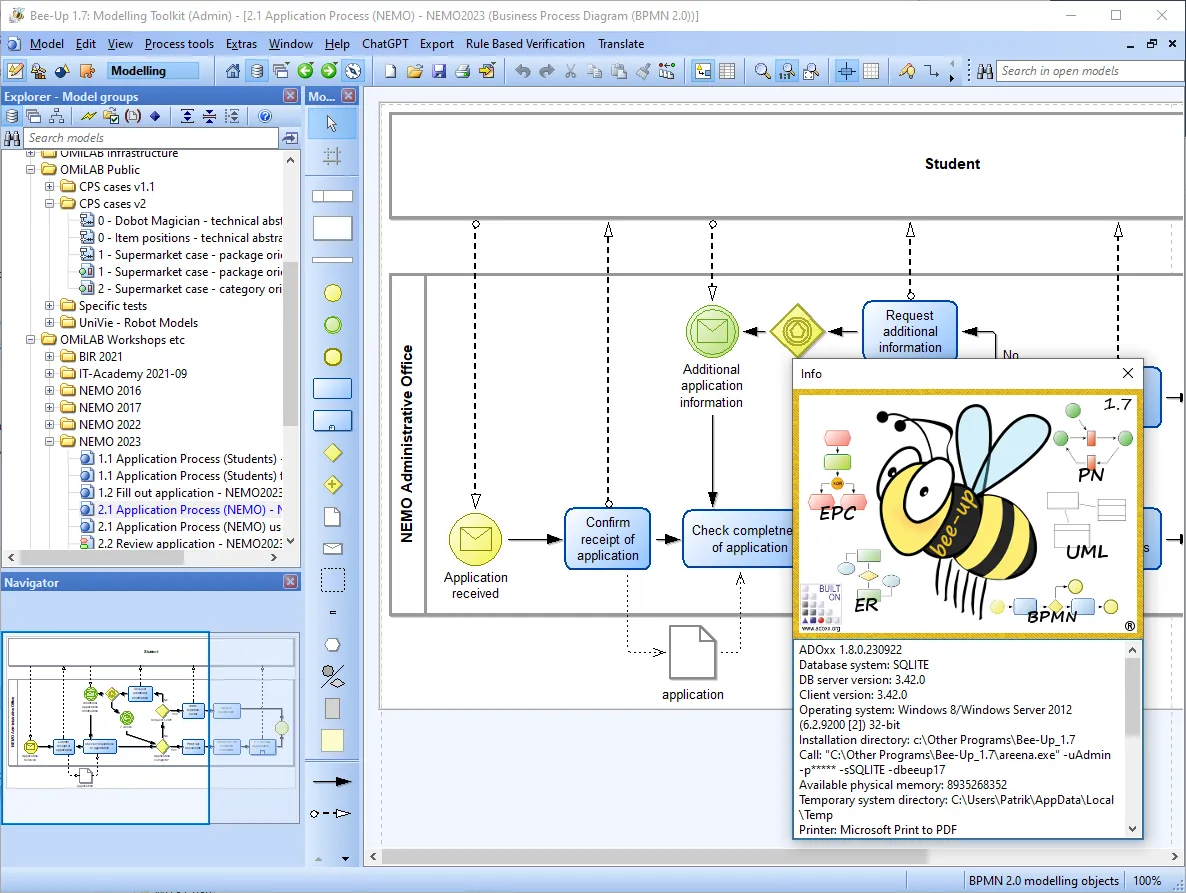
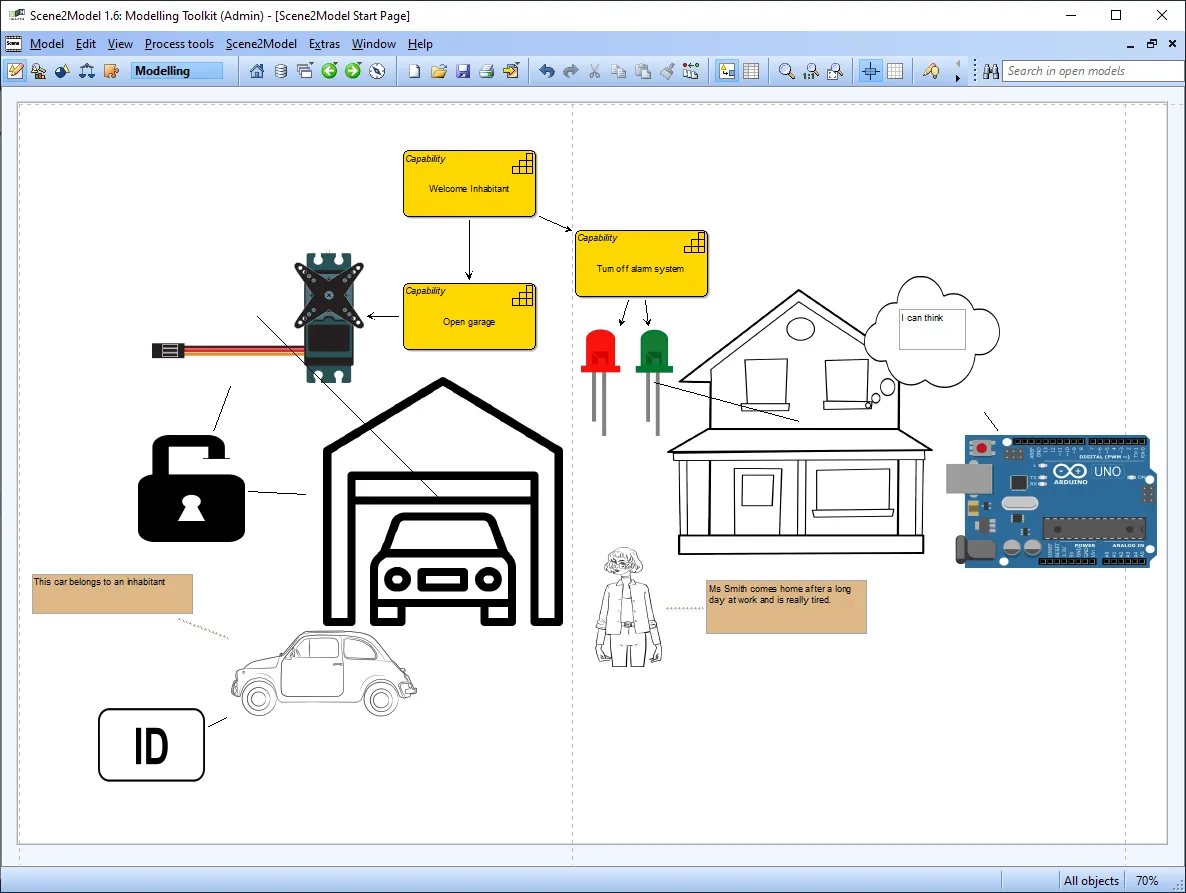
Low-Code Supported implementation and deployment of your full-fledged modelling tool.


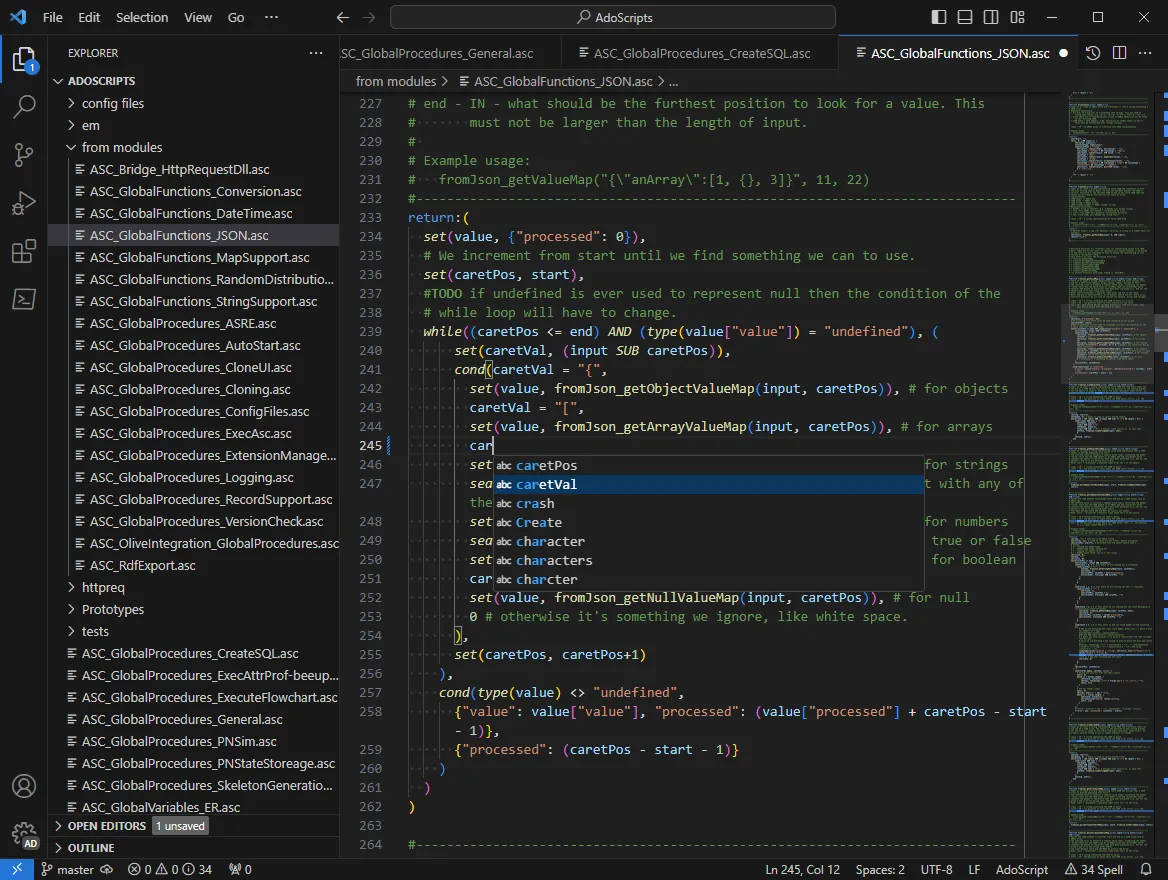
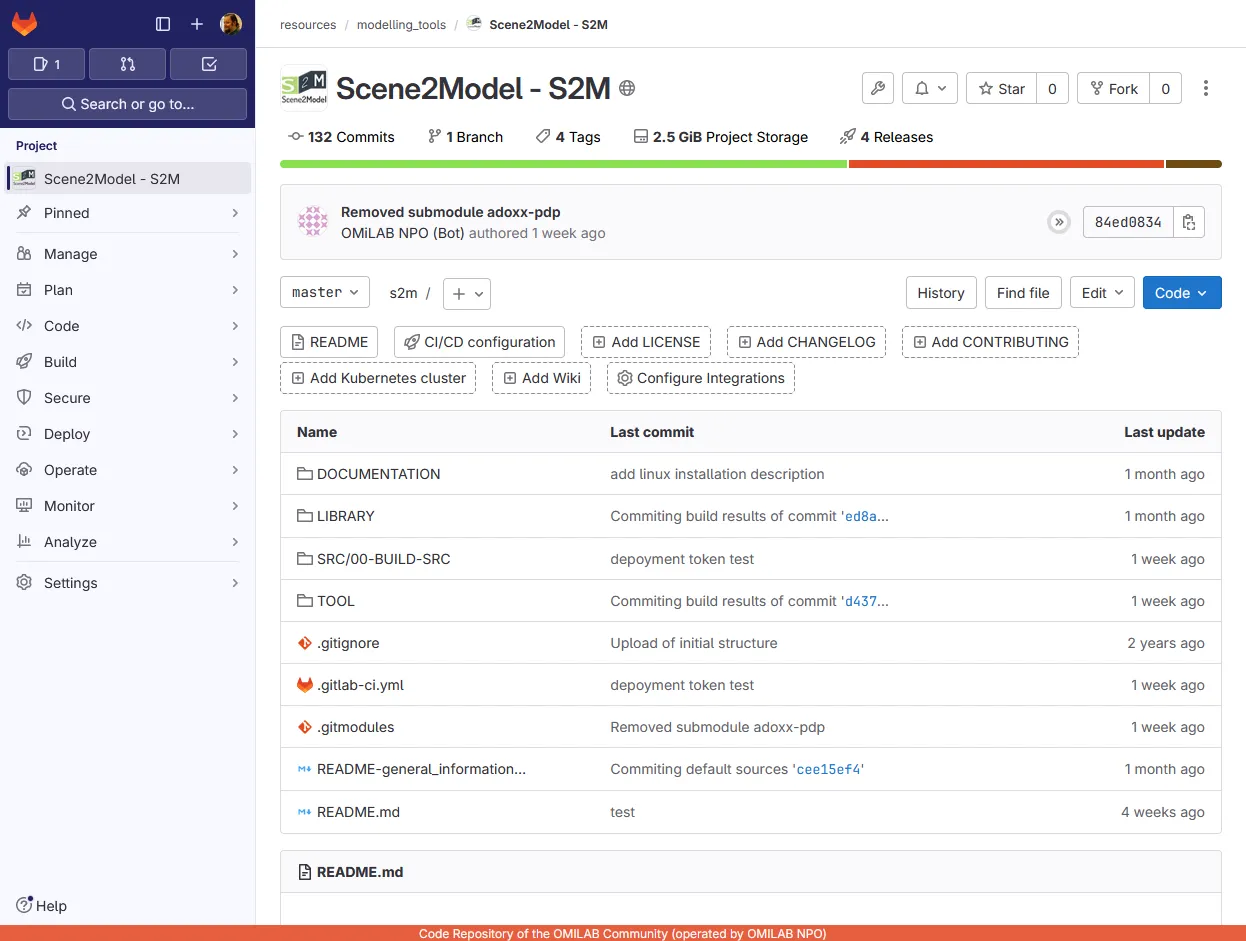
Tool repository for facilitating the implementation of your domain-specific modelling tools and their functionality. Learn more
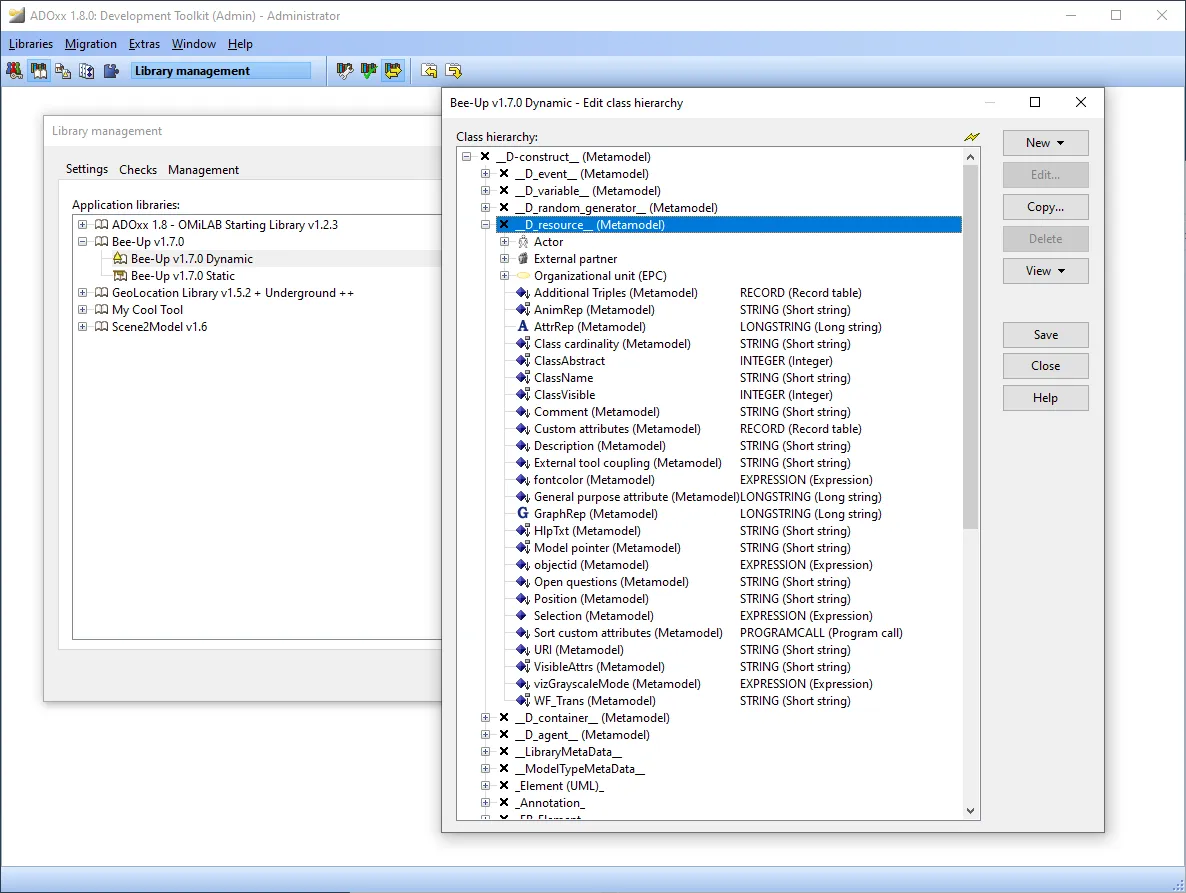
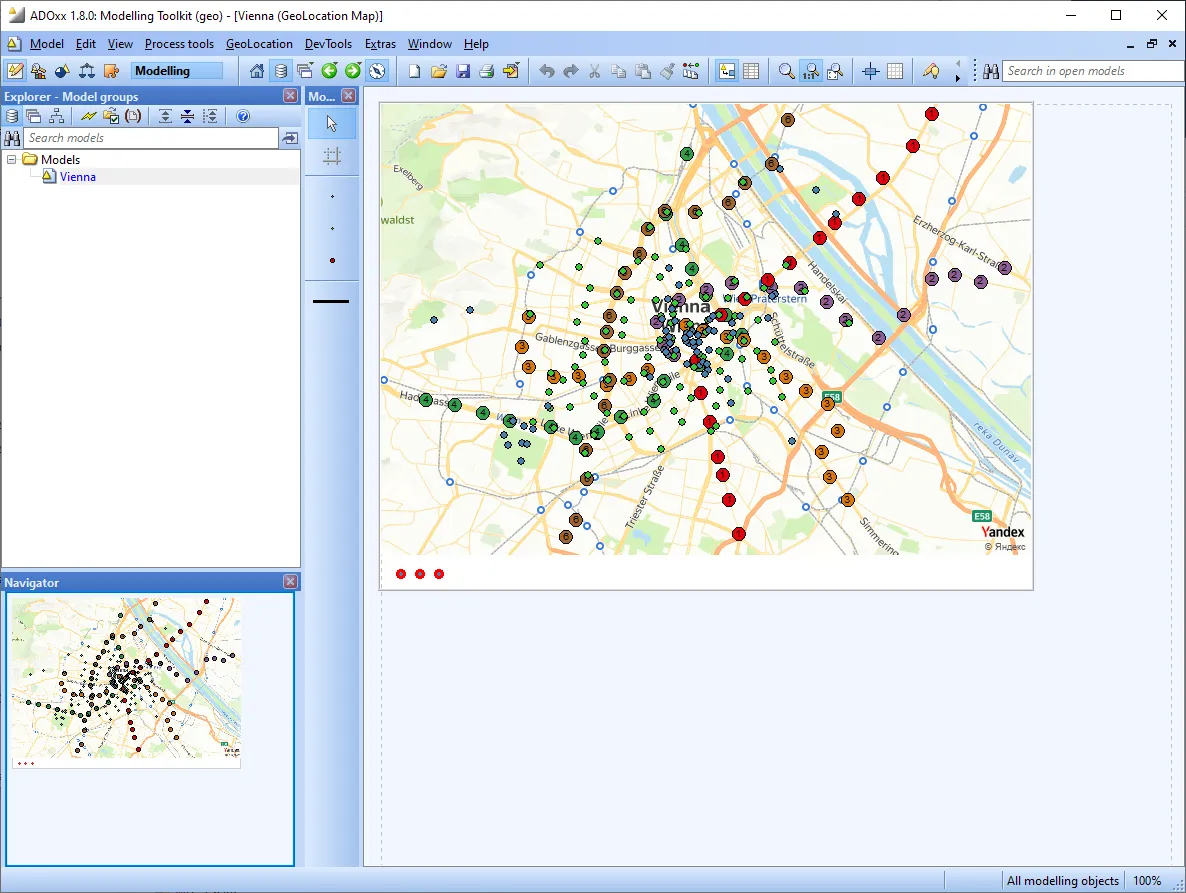
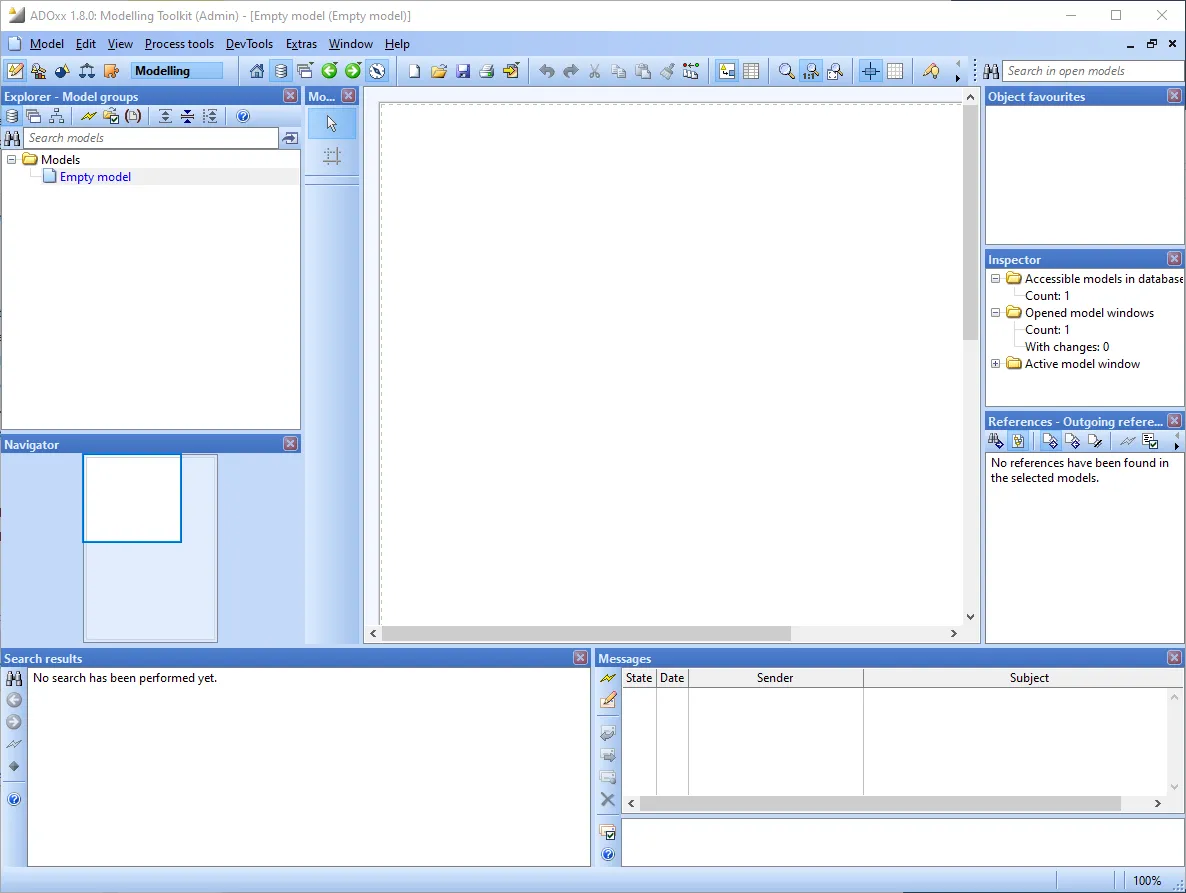
ADOxx is the meta-modelling platform for implementing domain-specific modelling tools.